Reactant A and B reacts to form the products C and D. The chances are that you have encountered this type of chemical reaction in your school days. While on paper they may seem as simple as drawing a bunch of arrows, in the real world, even the simplest of those reactions, takes a long time, money, and resources to formulate. The reaction time can vary from the order of seconds to the order of months.
Now, imagine waiting for a month for a reaction to complete only to find out that the yield of the reaction is too low. Or you end up with a bunch of side-products that you didn’t anticipate before. Or in some cases, the reaction didn’t complete at all. In such cases, not only the time is wasted but also the money and lab resources. Wouldn’t it be amazing if we could predict the main- and side-products for a chemical reaction beforehand, without any lab experimentation? If we could anticipate the unwanted products beforehand? In this article, we’re going to discuss a deep learning based approach that aims to achieve exactly that.
There have been many attempts over the years to predict the products of a chemical reaction without any lab experimentation. The approaches vary from template matching and heuristics-based methods to machine learning models.
In 2018, Coley et al. published a research paper titled A graph-convolutional neural network model for the prediction of chemical reactivity, in which they use a graph convolutional network model to predict the main- and side-products of a chemical reaction. What’s impressive is the fact that their algorithm is capable of predicting the products in over 85% of the cases, correctly.
How does scientists approach this problem in a lab?
There are majorly two steps involved in the process: first identifying all possible sites of reactivity and then evaluating their relative likelihood of a reaction. In other words, first, find all the atoms that are most likely to form (or break) a bond and then compare them to find the most reactive site.
Dataset
The authors used reactions from United States Patent and Trademark Office (USPTO) granted patents. After removing duplicates and erroneous reactions, the authors obtained a set of 480K reactions. Further, the dataset was divided into 400K, 40K, and 40K for training, testing, and validation purposes, respectively.
Representing molecules in a graph
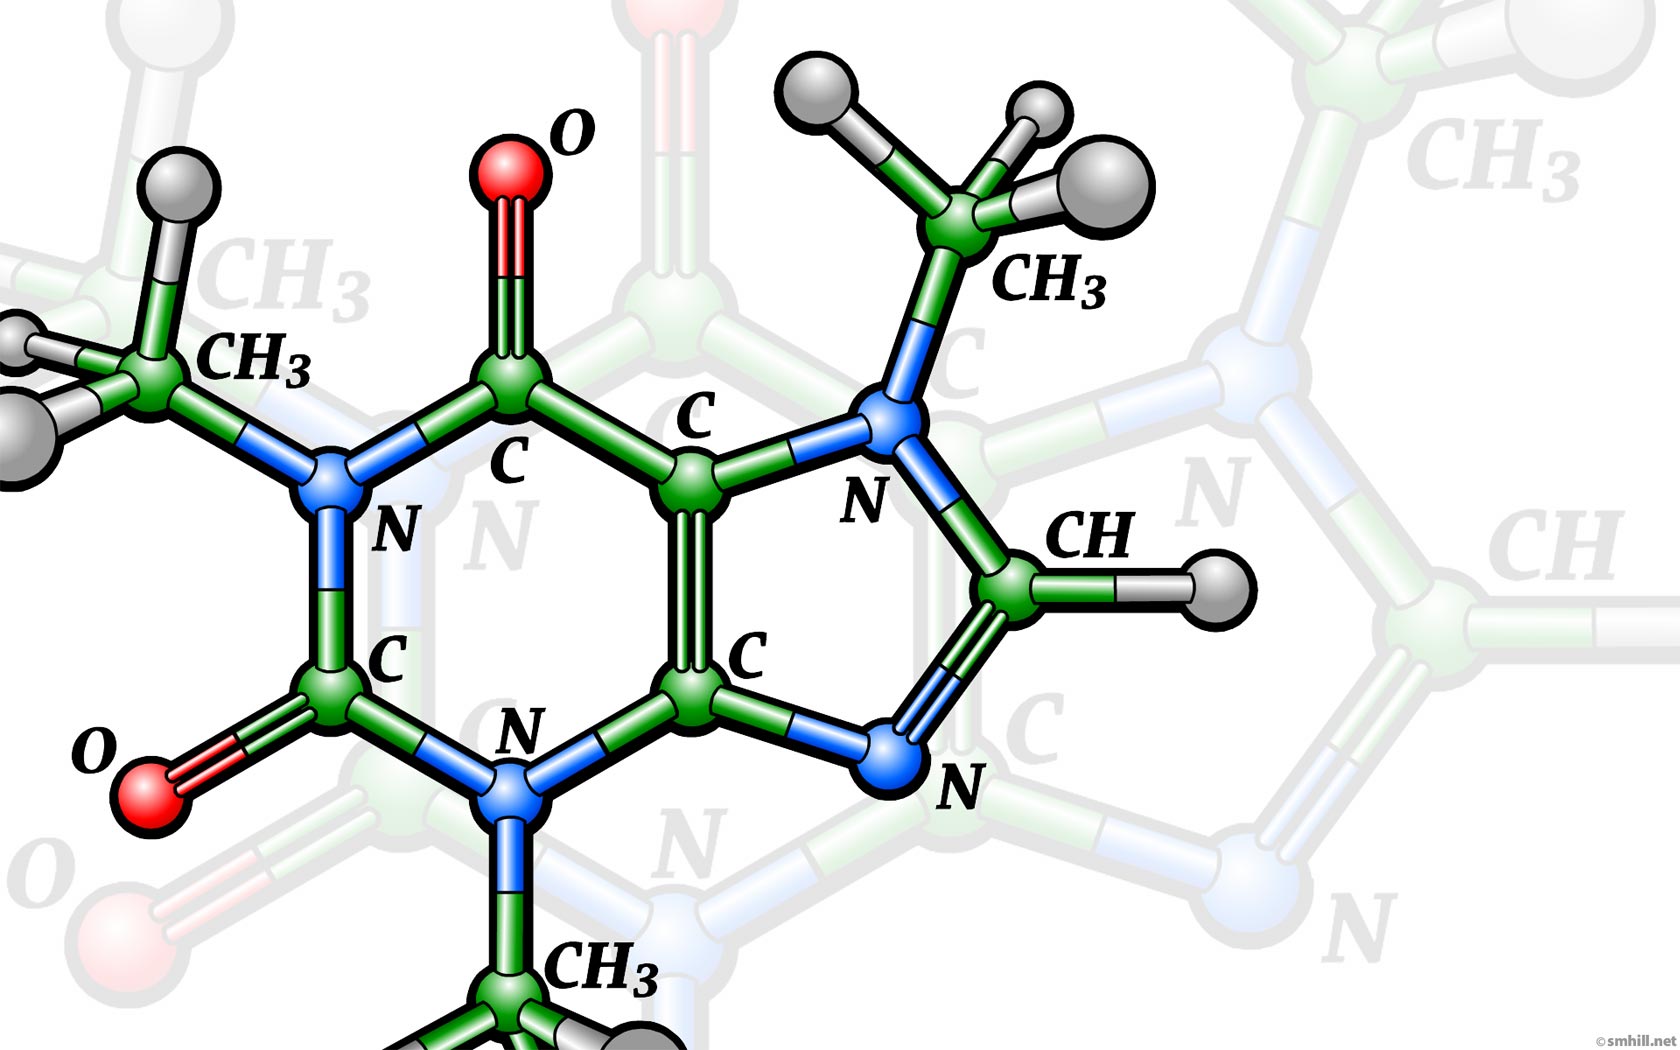
In any machine learning approach, featurizing the data is a very crucial step. In this task, we need to find a way to represent molecules in a way that both computer and the Graph Convolutional Network (GCN) model can understand. GCN is a powerful neural network architecture for machine learning on graphs. A graph consists of two elements: nodes and edges. For this task, atoms act as nodes, and the bonds between them as edges. Further, each node and edge can have properties. For example, in this case, atoms’ properties will be the properties of the nodes and bonds’ properties the features for the edges. Let’s take the example of Phenol. This is a Phenol molecule:
 And, a graph representation of Phenol will look something like this:
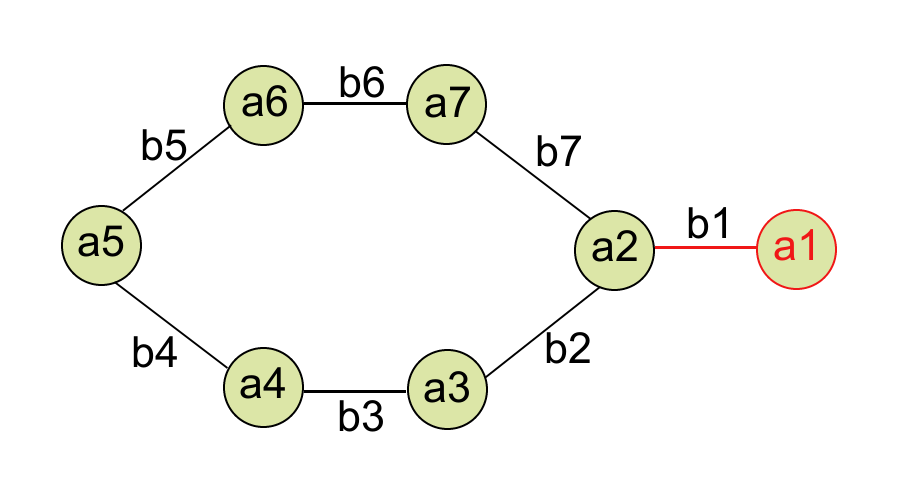 where a1, a2, …, a7 are node features and b1, b2, …, b7 are edge features. But what are these features? How do you featurize these nodes and edges? Let’s see how.
📝 Note: We’re ignoring the Hydrogen atoms for simplicity.
Node features
As we already discussed, each atom is a node and an atom’s properties are the node features. What properties do we consider for the atoms? It depends on the task at hand and is up to the user. Generally, the following six properties are considered:
- The type of atom, e.g. Carbon, Nitrogen, Oxygen, etc.
- Total degree of the atom (0, 1, 2, 3, 4, 5)
- Formal charge on the atom (-3, -2, -1, 0, 1, 2, 3)
- Explicit valence (1, 2, 3, 4, 5, 6)
- Implicit valence (0, 1, 2, 3, 4, 5)
- Whether the atom is aromatic (1 or 0)
All features are one-hot encoded. (What’s One-Hot encoding?)
For the sake of simplicity, let’s say only these four atoms H, C, N, and O are possible. Then, Table 1 shows the one-hot encoded matrix for the Phenol molecule. What about the Total degree of the atoms? Table 2 is the one-hot encoded matrix of degree values for Phenol.
| H | C | N | O | |
|---|---|---|---|---|
| O:1 | 0 | 0 | 0 | 1 |
| C:2 | 0 | 1 | 0 | 0 |
| C:3 | 0 | 1 | 0 | 0 |
| C:4 | 0 | 1 | 0 | 0 |
| C:5 | 0 | 1 | 0 | 0 |
| C:6 | 0 | 1 | 0 | 0 |
| C:7 | 0 | 1 | 0 | 0 |
| 0 | 1 | 2 | 3 | 4 | 5 | |
|---|---|---|---|---|---|---|
| O:1 | 0 | 1 | 0 | 0 | 0 | 0 |
| C:2 | 0 | 0 | 0 | 1 | 0 | 0 |
| C:3 | 0 | 0 | 1 | 0 | 0 | 0 |
| C:4 | 0 | 0 | 1 | 0 | 0 | 0 |
| C:5 | 0 | 0 | 1 | 0 | 0 | 0 |
| C:6 | 0 | 0 | 1 | 0 | 0 | 0 |
| C:7 | 0 | 0 | 1 | 0 | 0 | 0 |
Similarly, other 4 features can be calculated and converted into a one-hot encoded vector in the same fashion. After that, all vectors are concatenated to form a one long vector for each atom. For example, for Phenol, we have a total of 7 atoms and each atom is featured into a vecotr of length 30 (30 = 4 + 6 + 7 + 6 + 6 + 1), then the feature vector will look something like this:
a1: [0, 0, 0, 1, 0, 0, 0, 1, 0, 0, 0, 0, 1, 0, 0, 0, 0, 1, 0, 0, 0, 0, 0, 0, 1, 0, 0, 0, 0, 0]
a2: [0, 1, 0, 0, 0, 0, 0, 1, 0, 0, 0, 0, 0, 0, 1, 0, 0, 0, 0, 0, 1, 0, 0, 1, 0, 0, 0, 0, 0, 1]
a3: [0, 1, 0, 0, 0, 0, 0, 1, 0, 0, 0, 0, 0, 1, 0, 0, 0, 0, 0, 1, 0, 0, 0, 0, 1, 0, 0, 0, 0, 1]
a4: [0, 1, 0, 0, 0, 0, 0, 1, 0, 0, 0, 0, 0, 1, 0, 0, 0, 0, 0, 1, 0, 0, 0, 0, 1, 0, 0, 0, 0, 1]
a5: [0, 1, 0, 0, 0, 0, 0, 1, 0, 0, 0, 0, 0, 1, 0, 0, 0, 0, 0, 1, 0, 0, 0, 0, 1, 0, 0, 0, 0, 1]
a6: [0, 1, 0, 0, 0, 0, 0, 1, 0, 0, 0, 0, 0, 1, 0, 0, 0, 0, 0, 1, 0, 0, 0, 0, 1, 0, 0, 0, 0, 1]
a7: [0, 1, 0, 0, 0, 0, 0, 1, 0, 0, 0, 0, 0, 1, 0, 0, 0, 0, 0, 1, 0, 0, 0, 0, 1, 0, 0, 0, 0, 1]
Edge features
The bonds represent the edges. Generally, three properties are considered to featurize a bond:
- Bond type (Single, double, triple, or aromatic)
- Whether the bond is in conjugation (1 or 0)
- Whether the bond is part of an aromatic ring (1 or 0)
Once again, all values are one-hot encoded.
Let’s featurize the bond b1 as an example: It’s a single bond, so the feature vector is
[1, 0, 0, 0]
The bond is in conjugation with the aromatic ring so, the value is 1. and it’s not a part of an aromatic ring so the value is 0. The final feature vector for b1 will be:
[1, 0, 0, 0, 1, 0]
Similarly, all bonds can be featurized. Table 3 summarizes the complete edge feature list:
| Bond | SINGLE | DOUBLE | TRIPLE | AROMATIC | IsConjugated | IsInRing |
|---|---|---|---|---|---|---|
| b1 | 1 | 0 | 0 | 0 | 1 | 0 |
| b2 | 0 | 0 | 0 | 1 | 1 | 1 |
| b3 | 0 | 0 | 0 | 1 | 1 | 1 |
| b4 | 0 | 0 | 0 | 1 | 1 | 1 |
| b5 | 0 | 0 | 0 | 1 | 1 | 1 |
| b6 | 0 | 0 | 0 | 1 | 1 | 1 |
| b7 | 0 | 0 | 0 | 1 | 1 | 1 |
Structuring the problem
Now, we know how nodes and edges are featurized, let’s briefly explain how is this problem structured and the complete prediction process. Coley et al. designed their model architecture to reflect the methodology used by the actual lab scientists. There are majorly four steps are involved in the process:
- First step is what we have already discussed. Given a SMILES string for a molecule, the atoms and bonds are featurized to create a graph. See arrow 1 in the following figure. (What’s a SMILES string? Learn about it here)
- Next, a model is trained that learns to identify all possible sites of reactivity. This is analogous to lab scientists identifying the reactive functional groups in the reactants and reagents.
- After the second step, the model has given us a list of pairs of atoms that are most likely to form a bond or break an existing one. In this step, the authors enumerate to form all possible products from these bond changes and eliminate the ones which violate the valence rule. For example, see step D in the following figure where three of the products formed are invalid because of various atoms forming more bonds than their valence rule allowed.
- Lastly, another model is trained to assign a probability to each of these formed products. The candidate with the highest score can be treated as a major product while the ones with the lower score can sometimes help identify impurities (possible side products).
But how does it really work?
So far we have seen how the nodes and edges are featurized and how the task is structured to make the predictions. But how does the graph network actually work? How does it learn to decide the products? We’ll jump into that in the second part of this series.
Checkout Part 2 here.
References and Further Reading
- Coley, Connor W.; Jin, Wengong; Rogers, Luke; Jamison, Timothy F.; S Jaakkola, Tommi; Green, William H.; et al. (2018): A Graph-Convolutional Neural Network Model for the Prediction of Chemical Reactivity.
- Python and TensorFlow implementation of this paper is available here.
Share it on Twitter Facebook LinkedIn